picture 24: The measured dimension
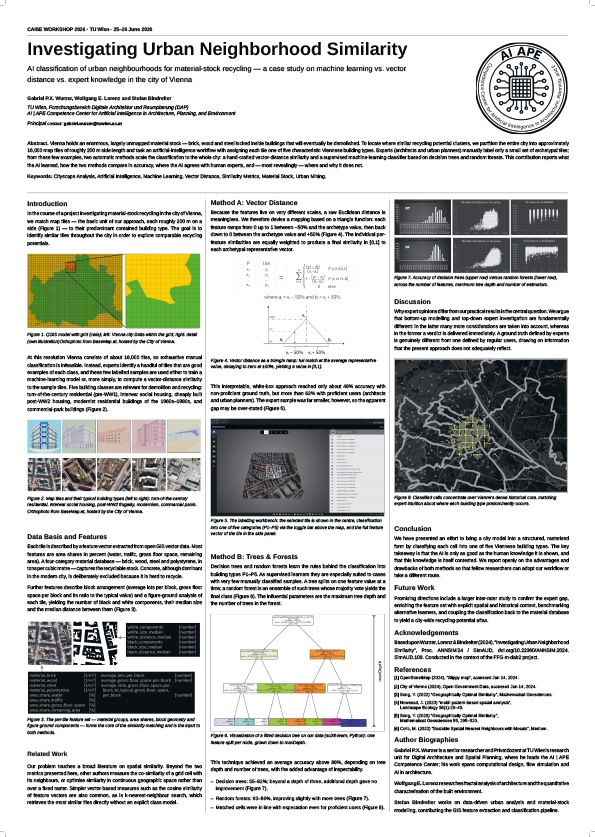
In the pictures below the coastline of Britain, taken from a map with a scale of 1:6.000.000, is replaced by five different polygons. The first one consists of seven 300 km straight-line segments which amount to a total length of 2289 km. This total length of the polygon increases by 232 km if the single polygon-line is reduced to 200 km. In the fourth picture 67.2 pieces of 50 km polygon-lines are required to enclose the coastline, which enlarge the total length to 3360 km. From this follows that the measured length of the polygons replacing the coastline increases when the scale, length of segments of the polygon, becomes smaller. Beside that as the straight-line segments are getting smaller and smaller, the polygon representing the coastline of Britain more and more approaches the shape on the map - which also means that the scale of the map, the exactness of the coastline, shows the limit for the size of the single straight-line segments. The replacing polygons are similar to the iterations of mathematical fractals, where the fractal curve is getting longer from one iteration to the next. The fractal dimension of the coastline indicates the increase in the length of the curve.
What will happen to a Euclidean structure such as a circle if its length, respectively its circumference, is measured by replacing polygons - can we observe an increase of length, too? The equation for the circumference of a circle is  , which amounts to 1256.63 units if we use a radius “R” of 200 units. The side of the polygon is calculated by the equation
  =2*R*sin(an/2). Defining
  , the angle of the first image, by 90 degrees this leads to =2*200*sin45=282.84 units. The circumference is again calculated by counting the pieces, in this case
  =4, and multiplying them by , which makes 1131 units. The length
  of the second polygon is given by =2*200*sin22.5=153.1 units which results in a total length of 1225 units. This shows that there is not much increase in length from the second , third - 1249 units -, fourth polygon - 1255 units - and finally to the calculated circumference of 1256 units.
 is marked on the curve. Where it hits the border, the distance
  is measured by using the equation
  , with
  being the total length and
  being the number of pieces of
  which is half the size of
  , the dimension of the border can finally be calculated as the comparison of both new polygons, see picture 24.