4.2.1 Self-Similarity Dimension "Ds"

The self-similarity dimension “Ds” is equivalent to Mandelbrot's fractal dimension “D”. It proceeds from the fact that in a self-similarity construction there exists a relationship between the scaling factor and the number of smaller pieces that the original construction is divided into[01]. This is true for fractal and non-fractal structures: e.g. a line, as an example for a non-fractal structure, can be divided into three identical parts. In this case the number of new pieces “a” is three and the reduction factor “s” is one third, see picture 23. The dimension “Ds” results from the equation:


a ... number of pieces
s ... reduction factor
Ds ... fractal dimension

  =>
means Ds=1 in the case of a line

picture 23: The line

A one-dimensional Euclidean line can be constructed like a mathematical fractal as being shown in the picture below. The initiator is a line, the generator for example three lines of the length of one third. The initiator is replaced by the generator, which is then repeated for all three new lines of the first iteration, for all nine lines of the second iteration and so on. The length of this curve increases by , with and “s” being the number of pieces respectively the reduction-factor of the generator and “n” being the number of iterations. If the starting line has the unit length of one, the first iteration amounts to a total length of and the second iteration to , which leads to the conclusion that in contrast to fractal curves there is no increase in length.

Equally a square can be divided into four pieces by using the reducing factor of one half. If the reducing factor is one third then this results in nine similar parts and so on:

Ds=log(a)/log(1/s)=log(4)/log(2)=log(9)/log(3)=2

In general an object is a non-fractal Euclidean structure if there is no growth in length, area or volume as one observes it more closely, which also leads to the conclusion that Euclidean objects always have an integer dimension equal to its topological dimension. In contrast to that, fractal curves are objects that’s fractal dimension is greater than its topological dimension. E.g. the self-similarity dimension Ds of the topological one-dimensional Peano curve is generated by Ds=log(9)/log(1/3)=2. In this case the curve fills the surface it is lying on completely but if only one point is taken off, the curve nevertheless falls apart into two pieces.

The self-similarity dimension of the Koch curve:
 a=4; s=1/3;

 Ds=log(a)/log(1/s)=log(4)/log(3)=1.26186

The dimension can also be measured by using two different scales - scale comparison:

 ... number of pieces of the 1st scale=4
 ... number of pieces of the 2nd scale=16
 ... reduction factor of the 1st scale=1/3
 ... reduction factor of the 2nd scale=1/9
 Ds... fractal dimension measured by the comparison of the 1st and 2nd iteration of the Koch curve.

Footnotes

[01] The smallest “rn” for natural structures also has to be choosen carefully because at one stage the scale of "rn" becomes as small as the scale of the image itself and no increase in length would be observed. This is then called the lower scale of the object.

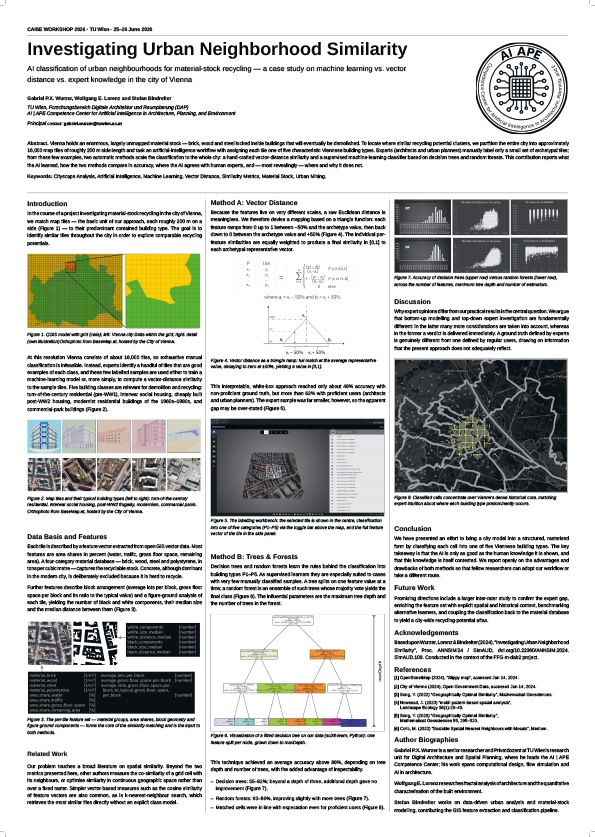
Investigating Urban Neighborhood Similarity

AI classification of urban neighbourhoods for material-stock recycling — a case study on machine learning vs. vector distance vs. expert knowledge in the city of Vienna

Vienna holds an enormous, largely unmapped material stock — brick, wood and steel locked inside buildings that will eventually be demolished. To locate where similar recycling potential clusters, we partition the entire city into approximately 16,000 map ...

AlgoPlana 2026

Proceedings of the ALGOPLANA Conference 2026

The students‘ conference “Algorithms in Planning Practice 2026” is the result of a seminar held at the Research Unit Digital Architecture and Planning at the TU Wien in the summer semester 2026. ...

Urban Transformation Between Built and NaturalSystems by Means of an Adapted Wave FunctionCollapse Approach

Journal Paper In JoDLA –  Journal of Digital Landscape Architecture (e-ISSN 2511-624X)

In practice, urban transformation is often carried out at the outskirts or in between existing areas of a city. In that context, important questions are: How can one imagine a transition between different urban structures? ...

Healthcare and Wellbeing

Presentation: at the School of Environment and Society, Institute of Science Tokyo, Japan

This presentation explores process-driven approaches to healthcare design through early-stage functional planning and agent-based simulation. ...

Urban Data

Presentation: at the School of Environment and Society, Institute of Science Tokyo, Japan

This presentation explores how municipal data provided by the City of Vienna can be used to support urban analysis, planning, and decision-making. ...

eCAADe 2025:
Artificially Interactive Individualized Genetic Algorithms (AIIGA) for Gestalt Analysis

Evolutionary algorithms enhanced with sAI in architectural design
Talk and Proceeding: eCAADe 2025 – Confluence (Ankara, Turkey | conference)

This research is concerned with the automation of the user interventional aspect within interactive genetic algorithms (IGA) as already explored in previous publications by the authors considering their use for Gestalt analyses and generative design optimization. ...